SLIDESHOW: Top 5 Cheap Dividend Stocks Below $5
By Dividend Channel Staff, updated Fri, April 19, 3:07 PM
| This Slide: #2 of 5 |
#4. City Office REIT
Trading Symbol
CIO
Recent Price
4.46
Dividend Yield
8.97%
TTM Earnings
1.39
PE Ratio (TTM)
3.2
Market Cap
179.1M
#4. City Office REIT
Trading Symbol
CIO
Recent Price
4.46
Dividend Yield
8.97%
TTM Earnings
1.39
PE Ratio (TTM)
3.2
Market Cap
179.1M
City Office REIT is a holding company. Through its subsidiaries, Co. is engaged in owning, operating and acquiring office properties located in the Southern and Western U.S. Co. owns several office complexes comprised of various office buildings in the metropolitan areas of Dallas, Denver, Orlando, Phoenix, Portland, Raleigh, San Diego, Seattle and Tampa.
 View CIO's Dividend History »
  ETFs holding CIO »
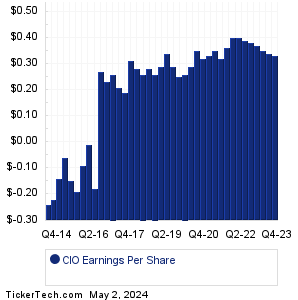
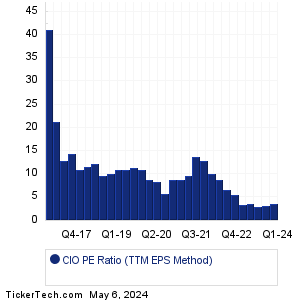
Should City Office REIT shares be counted among the Top 5 Cheap Dividend Stocks Below $5 label? To start, we see that the recent trading price for CIO stock is $4.46 and the dividend yield is 8.97% (as of 4/18/2024). The most recent quarter's (MRQ) earnings result, annualized, was $1.32/share. Looking at the sum total of quarterly earnings across the trailing twelve month (TTM) period, City Office REIT produced $1.39/share. And taking the median quarterly result across the TTM period, and annualizing it, results in $1.36/share. Comparing the current indicated annual dividend rate of $0.40 against that median result, we calculate a dividend payout ratio of 29.4%. Comparing the company's various earnings metrics against the stock price, we end up with a PE ratio of 3.3 for the TTM Median method, 3.4 for price to earnings using MRQ annualized, and 3.2 for current price/TTM earnings. Based on CIO's history, that recent TTM PE is low relative to the historical average, with the recent PE 69.8% lower than the average (TTM method) of 10.6.
Should City Office REIT shares be counted among the Top 5 Cheap Dividend Stocks Below $5 label? To start, we see that the recent trading price for CIO stock is $4.46 and the dividend yield is 8.97% (as of 4/18/2024). The most recent quarter's (MRQ) earnings result, annualized, was $1.32/share. Looking at the sum total of quarterly earnings across the trailing twelve month (TTM) period, City Office REIT produced $1.39/share. And taking the median quarterly result across the TTM period, and annualizing it, results in $1.36/share. Comparing the current indicated annual dividend rate of $0.40 against that median result, we calculate a dividend payout ratio of 29.4%. Comparing the company's various earnings metrics against the stock price, we end up with a PE ratio of 3.3 for the TTM Median method, 3.4 for price to earnings using MRQ annualized, and 3.2 for current price/TTM earnings. Based on CIO's history, that recent TTM PE is low relative to the historical average, with the recent PE 69.8% lower than the average (TTM method) of 10.6.
CIO Next Dividend Date » (Projection based upon history) CIO Dividend Growth Rate » Quotes delayed 20 minutes |
| Avg. Broker Rec.
|
Hold (2.40 out of 4) 100th percentile
(ranked higher than approx. 100% of all stocks covered)
Analysts' Target Price: CIO Forecast Based on data provided by Zacks Investment Research via Quandl.com |
|
|