
SLIDESHOW: Top 15 Cheap Consumer Shares
By Dividend Channel Staff, updated Mon, April 29, 4:27 AM
| This Slide: #1 of 15 |
#15. Malibu Boats
Trading Symbol
MBUU
Recent Price
34.15
TTM Earnings
7.27
PE Ratio (TTM)
4.7
Avg Past PE (TTM)
13.6
Market Cap
697.7M
#15. Malibu Boats
Trading Symbol
MBUU
Recent Price
34.15
TTM Earnings
7.27
PE Ratio (TTM)
4.7
Avg Past PE (TTM)
13.6
Market Cap
697.7M
Malibu Boats is a holding company. Through its subsidiaries, Co. is a designer, manufacturer and marketer of recreational powerboats, including performance sport boats, sterndrive and outboard boats under eight brands including Malibu, Axis, Pursuit, Maverick, Cobia, Pathfinder, Hewes and Cobalt. Co.'s product portfolio of brands are used for recreational boating activities including, among others, water sports such as water skiing, wakeboarding and wake surfing, as well as general recreational boating and fishing. Co.'s boats are constructed of fiberglass, available in a range of sizes, hull designs and propulsion systems. Co. also provides various accessories and aftermarket parts. More details about Malibu Boats at: http://www.malibuboats.com.
 ETFs holding MBUU »
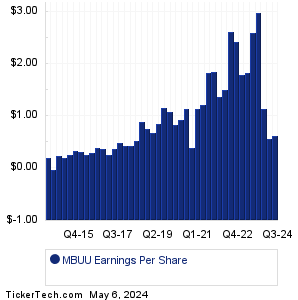
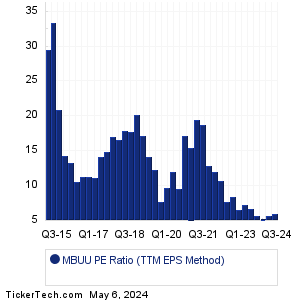
Should Malibu Boats shares be counted among the Top 15 Cheap Consumer Shares? To start, we see that the recent trading price for MBUU stock is $34.15 (as of 4/26/2024). The most recent quarter's (MRQ) earnings result, annualized, was $2.28/share. Looking at the sum total of quarterly earnings across the trailing twelve month (TTM) period, Malibu Boats produced $7.27/share. And taking the median quarterly result across the TTM period, and annualizing it, results in $7.44/share. Comparing these various earnings metrics against the stock price, we end up with a PE ratio of 4.6 for the TTM Median method, 15.0 for price to earnings using MRQ annualized, and 4.7 for current price/TTM earnings. Based on MBUU's history, that recent TTM PE is low relative to the historical average, with the recent PE 65.4% lower than the average (TTM method) of 13.6.
Should Malibu Boats shares be counted among the Top 15 Cheap Consumer Shares? To start, we see that the recent trading price for MBUU stock is $34.15 (as of 4/26/2024). The most recent quarter's (MRQ) earnings result, annualized, was $2.28/share. Looking at the sum total of quarterly earnings across the trailing twelve month (TTM) period, Malibu Boats produced $7.27/share. And taking the median quarterly result across the TTM period, and annualizing it, results in $7.44/share. Comparing these various earnings metrics against the stock price, we end up with a PE ratio of 4.6 for the TTM Median method, 15.0 for price to earnings using MRQ annualized, and 4.7 for current price/TTM earnings. Based on MBUU's history, that recent TTM PE is low relative to the historical average, with the recent PE 65.4% lower than the average (TTM method) of 13.6.
| Avg. Broker Rec.
|
Buy (3.00 out of 4) 33rd percentile
(ranked lower than approx. 67% of all stocks covered)
Analysts' Target Price: MBUU Forecast Based on data provided by Zacks Investment Research via Quandl.com |
|
|