SLIDESHOW: Top 15 Cheap Services Shares
By Dividend Channel Staff, updated Sun, May 5, 6:58 AM
| This Slide: #1 of 15 |
#15. Boyd Gaming
Trading Symbol
BYD
Recent Price
54.12
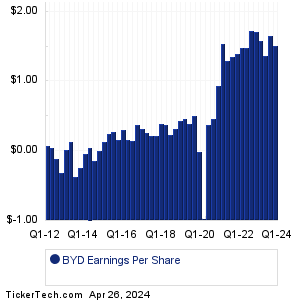
TTM Earnings
6.11
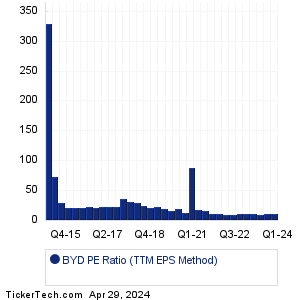
PE Ratio (TTM)
8.9
Avg Past PE (TTM)
31.4
Market Cap
5.2B
#15. Boyd Gaming
Trading Symbol
BYD
Recent Price
54.12
TTM Earnings
6.11
PE Ratio (TTM)
8.9
Avg Past PE (TTM)
31.4
Market Cap
5.2B
Boyd Gaming is a multi-jurisdictional gaming company. Co. operates wholly owned gaming entertainment properties in Nevada, Illinois, Indiana, Iowa, Kansas, Louisiana, Mississippi, Missouri, Ohio and Pennsylvania. Co. has three segments: Las Vegas Locals, which includes casinos that primarily serve the resident population; Downtown Las Vegas, which focuses on gaming enthusiasts from Hawaii and tour and travel agents in Hawaii; and Midwest and South, which consists of land-based casinos, dockside riverboat casinos, racinos and barge-based casinos. Co. also owns and operates a travel agency and a captive insurance company that underwrites travel-related insurance, each located in Hawaii. More details about Boyd Gaming at: http://www.boydgaming.com.
 ETFs holding BYD »
Should Boyd Gaming shares be counted among the Top 15 Cheap Services Shares? To start, we see that the recent trading price for BYD stock is $54.12 (as of 5/3/2024). The most recent quarter's (MRQ) earnings result, annualized, was $6.04/share. Looking at the sum total of quarterly earnings across the trailing twelve month (TTM) period, Boyd Gaming produced $6.11/share. And taking the median quarterly result across the TTM period, and annualizing it, results in $6.16/share. Comparing these various earnings metrics against the stock price, we end up with a PE ratio of 8.8 for the TTM Median method, 9.0 for price to earnings using MRQ annualized, and 8.9 for current price/TTM earnings. Based on BYD's history, that recent TTM PE is low relative to the historical average, with the recent PE 71.7% lower than the average (TTM method) of 31.4.
Should Boyd Gaming shares be counted among the Top 15 Cheap Services Shares? To start, we see that the recent trading price for BYD stock is $54.12 (as of 5/3/2024). The most recent quarter's (MRQ) earnings result, annualized, was $6.04/share. Looking at the sum total of quarterly earnings across the trailing twelve month (TTM) period, Boyd Gaming produced $6.11/share. And taking the median quarterly result across the TTM period, and annualizing it, results in $6.16/share. Comparing these various earnings metrics against the stock price, we end up with a PE ratio of 8.8 for the TTM Median method, 9.0 for price to earnings using MRQ annualized, and 8.9 for current price/TTM earnings. Based on BYD's history, that recent TTM PE is low relative to the historical average, with the recent PE 71.7% lower than the average (TTM method) of 31.4.
BYD Next Dividend Date » (Projection based upon history) BYD Dividend Growth Rate » Quotes delayed 20 minutes |
| Avg. Broker Rec.
|
Buy (2.62 out of 4) 16th percentile
(ranked lower than approx. 84% of all stocks covered)
Analysts' Target Price: BYD Forecast Based on data provided by Zacks Investment Research via Quandl.com |
|
|