SLIDESHOW: Top 15 Cheap Utilities Shares
By Dividend Channel Staff, updated Sat, April 27, 5:10 PM
| This Slide: #1 of 15 |
#15. Xcel Energy
Trading Symbol
XEL
Recent Price
53.96
TTM Earnings
3.46
PE Ratio (TTM)
15.6
Avg Past PE (TTM)
20.1
Market Cap
30.0B
#15. Xcel Energy
Trading Symbol
XEL
Recent Price
53.96
TTM Earnings
3.46
PE Ratio (TTM)
15.6
Avg Past PE (TTM)
20.1
Market Cap
30.0B
Xcel Energy is a holding company. Through its subsidiaries, Co. is a regulated electric and natural gas delivery company. Co. serves customers in several mid-western and western states, including portions of Colorado, Michigan, Minnesota, New Mexico, North Dakota, South Dakota, Texas and Wisconsin. Co. provides a portfolio of energy-related products and services to its electric customers and natural gas customers through its utility subsidiaries (i.e., Northern States Power Company (Minnesota), Northern States Power Company (Wisconsin), Public Service Company of Colorado and Southwestern Public Service Company). More details about Xcel Energy at: http://www.xcelenergy.com.
 ETFs holding XEL »
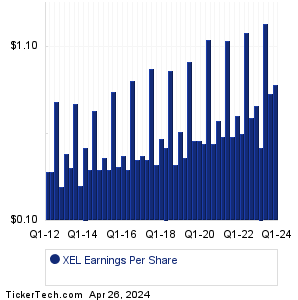
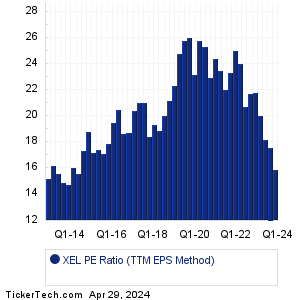
Should Xcel Energy shares be counted among the Top 15 Cheap Utilities Shares? To start, we see that the recent trading price for XEL stock is $53.96 (as of 4/26/2024). The most recent quarter's (MRQ) earnings result, annualized, was $3.52/share. Looking at the sum total of quarterly earnings across the trailing twelve month (TTM) period, Xcel Energy produced $3.46/share. And taking the median quarterly result across the TTM period, and annualizing it, results in $3.4/share. Comparing these various earnings metrics against the stock price, we end up with a PE ratio of 15.9 for the TTM Median method, 15.3 for price to earnings using MRQ annualized, and 15.6 for current price/TTM earnings. Based on XEL's history, that recent TTM PE is low relative to the historical average, with the recent PE 22.4% lower than the average (TTM method) of 20.1.
Should Xcel Energy shares be counted among the Top 15 Cheap Utilities Shares? To start, we see that the recent trading price for XEL stock is $53.96 (as of 4/26/2024). The most recent quarter's (MRQ) earnings result, annualized, was $3.52/share. Looking at the sum total of quarterly earnings across the trailing twelve month (TTM) period, Xcel Energy produced $3.46/share. And taking the median quarterly result across the TTM period, and annualizing it, results in $3.4/share. Comparing these various earnings metrics against the stock price, we end up with a PE ratio of 15.9 for the TTM Median method, 15.3 for price to earnings using MRQ annualized, and 15.6 for current price/TTM earnings. Based on XEL's history, that recent TTM PE is low relative to the historical average, with the recent PE 22.4% lower than the average (TTM method) of 20.1.
XEL Next Dividend Date » (Projection based upon history) XEL Dividend Growth Rate » Quotes delayed 20 minutes |
| Avg. Broker Rec.
|
Buy (3.00 out of 4) 29th percentile
(ranked lower than approx. 71% of all stocks covered)
Analysts' Target Price: XEL Forecast Based on data provided by Zacks Investment Research via Quandl.com |
|
|