SLIDESHOW: Top 15 Cheap Healthcare Shares
By Dividend Channel Staff, updated Sat, May 4, 6:03 AM
| This Slide: #1 of 15 |
#15. Pediatrix Medical Group
Trading Symbol
MD
Recent Price
9.33
TTM Earnings
1.26
PE Ratio (TTM)
7.4
Avg Past PE (TTM)
14.5
Market Cap
784.0M
#15. Pediatrix Medical Group
Trading Symbol
MD
Recent Price
9.33
TTM Earnings
1.26
PE Ratio (TTM)
7.4
Avg Past PE (TTM)
14.5
Market Cap
784.0M
Pediatrix Medical Group is a provider of physician services including newborn, maternal-fetal, pediatric cardiology and other pediatric subspecialty care. Co.'s network comprised of physicians, including physicians who provide neonatal clinical care, primarily within hospital-based neonatal intensive care units, to babies born prematurely or with medical complications. Co.'s network also includes other pediatric subspecialists, including physicians providing pediatric intensive care, physicians providing pediatric cardiology care, physicians providing hospital-based pediatric care, physicians providing pediatric surgical care and urology services, and physicians providing pediatric ear. More details about Pediatrix Medical Group at: http://www.Pediatrix.com.
 ETFs holding MD »
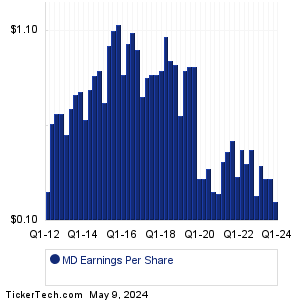
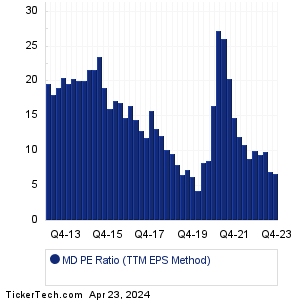
Should Pediatrix Medical Group shares be counted among the Top 15 Cheap Healthcare Shares? To start, we see that the recent trading price for MD stock is $9.33 (as of 5/3/2024). The most recent quarter's (MRQ) earnings result, annualized, was $1.28/share. Looking at the sum total of quarterly earnings across the trailing twelve month (TTM) period, Pediatrix Medical Group produced $1.26/share. And taking the median quarterly result across the TTM period, and annualizing it, results in $1.28/share. Comparing these various earnings metrics against the stock price, we end up with a PE ratio of 7.3 for the TTM Median method, 7.3 for price to earnings using MRQ annualized, and 7.4 for current price/TTM earnings. Based on MD's history, that recent TTM PE is low relative to the historical average, with the recent PE 49.0% lower than the average (TTM method) of 14.5.
Should Pediatrix Medical Group shares be counted among the Top 15 Cheap Healthcare Shares? To start, we see that the recent trading price for MD stock is $9.33 (as of 5/3/2024). The most recent quarter's (MRQ) earnings result, annualized, was $1.28/share. Looking at the sum total of quarterly earnings across the trailing twelve month (TTM) period, Pediatrix Medical Group produced $1.26/share. And taking the median quarterly result across the TTM period, and annualizing it, results in $1.28/share. Comparing these various earnings metrics against the stock price, we end up with a PE ratio of 7.3 for the TTM Median method, 7.3 for price to earnings using MRQ annualized, and 7.4 for current price/TTM earnings. Based on MD's history, that recent TTM PE is low relative to the historical average, with the recent PE 49.0% lower than the average (TTM method) of 14.5.
| Avg. Broker Rec.
|
Hold (1.87 out of 4) 0th percentile
(ranked lower than approx. 100% of all stocks covered)
Analysts' Target Price: MD Forecast Based on data provided by Zacks Investment Research via Quandl.com |
|
|