SLIDESHOW: Top 10 Cheap Financial Stocks
By Dividend Channel Staff, updated Sat, May 4, 6:32 AM
| This Slide: #1 of 10 |
#10. Brighthouse Finl
Trading Symbol
BHF
Recent Price
48.99
TTM Earnings
14.09
PE Ratio (TTM)
3.5
Avg Past PE (TTM)
3.9
Market Cap
3.1B
#10. Brighthouse Finl
Trading Symbol
BHF
Recent Price
48.99
TTM Earnings
14.09
PE Ratio (TTM)
3.5
Avg Past PE (TTM)
3.9
Market Cap
3.1B
Brighthouse Financial is a holding company. Through its subsidiaries, Co. is a provider of annuity and life insurance products. Co. is organized into three segments: annuities, which consists of variable, fixed, index-linked and income annuities designed to address contract holders' needs for protected wealth accumulation on a tax-deferred basis, wealth transfer and income security; life, which consists of insurance products and services, including term, universal, whole and variable life products designed to address policyholders' needs for financial security and protected wealth transfer; and run-off, which consists of products no longer actively sold and which are separately managed. More details about Brighthouse Finl at: http://www.brighthousefinancial.com.
 ETFs holding BHF »
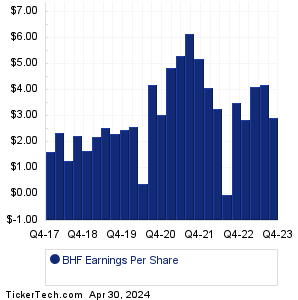
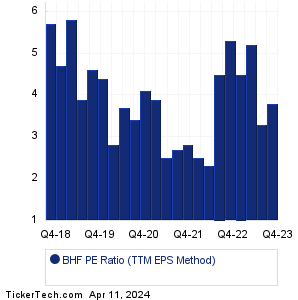
Should Brighthouse Finl shares be counted among the Top 10 Cheap Financial Stocks? To start, we see that the recent trading price for BHF stock is $48.99 (as of 5/3/2024). The most recent quarter's (MRQ) earnings result, annualized, was $11.68/share. Looking at the sum total of quarterly earnings across the trailing twelve month (TTM) period, Brighthouse Finl produced $14.09/share. And taking the median quarterly result across the TTM period, and annualizing it, results in $14.08/share. Comparing these various earnings metrics against the stock price, we end up with a PE ratio of 3.5 for the TTM Median method, 4.2 for price to earnings using MRQ annualized, and 3.5 for current price/TTM earnings. Based on BHF's history, that recent TTM PE is low relative to the historical average, with the recent PE 10.3% lower than the average (TTM method) of 3.9.
Should Brighthouse Finl shares be counted among the Top 10 Cheap Financial Stocks? To start, we see that the recent trading price for BHF stock is $48.99 (as of 5/3/2024). The most recent quarter's (MRQ) earnings result, annualized, was $11.68/share. Looking at the sum total of quarterly earnings across the trailing twelve month (TTM) period, Brighthouse Finl produced $14.09/share. And taking the median quarterly result across the TTM period, and annualizing it, results in $14.08/share. Comparing these various earnings metrics against the stock price, we end up with a PE ratio of 3.5 for the TTM Median method, 4.2 for price to earnings using MRQ annualized, and 3.5 for current price/TTM earnings. Based on BHF's history, that recent TTM PE is low relative to the historical average, with the recent PE 10.3% lower than the average (TTM method) of 3.9.
| Avg. Broker Rec.
|
Sell (1.30 out of 4) 0th percentile
(ranked lower than approx. 100% of all stocks covered)
Analysts' Target Price: BHF Forecast Based on data provided by Zacks Investment Research via Quandl.com |
|
|