
SLIDESHOW: Top 10 Cheap Industrials Stocks
By Dividend Channel Staff, updated Mon, April 29, 7:49 AM
| This Slide: #1 of 10 |
#10. Forward Air
Trading Symbol
FWRD
Recent Price
22.27
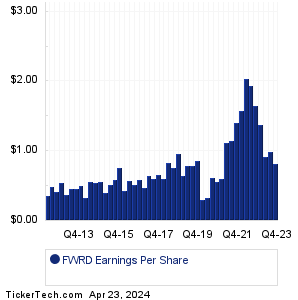
TTM Earnings
4.08
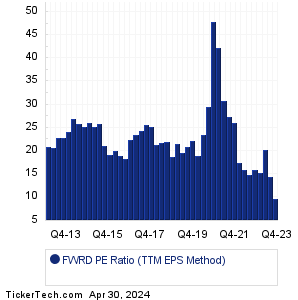
PE Ratio (TTM)
5.5
Avg Past PE (TTM)
22.7
Market Cap
587.3M
#10. Forward Air
Trading Symbol
FWRD
Recent Price
22.27
TTM Earnings
4.08
PE Ratio (TTM)
5.5
Avg Past PE (TTM)
22.7
Market Cap
587.3M
Forward Air is an asset-light freight and logistics company. Co. provides less-than-truckload (LTL), final mile, truckload and intermodal drayage services across the U.S. and in Canada. Co.'s services are classified into two reportable segments: Expedited Freight and Intermodal. Co.'s Expedited Freight segment provides expedited regional, inter-regional and national LTL services. Co.'s Intermodal segment provides first- and last-mile intermodal container drayage services both to and from seaports and railheads. Intermodal also provides contract and container freight station warehouse and handling services. More details about Forward Air at: http://www.forwardaircorp.com.
 ETFs holding FWRD »
Should Forward Air shares be counted among the Top 10 Cheap Industrials Stocks? To start, we see that the recent trading price for FWRD stock is $22.27 (as of 4/26/2024). The most recent quarter's (MRQ) earnings result, annualized, was $3.24/share. Looking at the sum total of quarterly earnings across the trailing twelve month (TTM) period, Forward Air produced $4.08/share. And taking the median quarterly result across the TTM period, and annualizing it, results in $3.8/share. Comparing these various earnings metrics against the stock price, we end up with a PE ratio of 5.9 for the TTM Median method, 6.9 for price to earnings using MRQ annualized, and 5.5 for current price/TTM earnings. Based on FWRD's history, that recent TTM PE is low relative to the historical average, with the recent PE 75.8% lower than the average (TTM method) of 22.7.
Should Forward Air shares be counted among the Top 10 Cheap Industrials Stocks? To start, we see that the recent trading price for FWRD stock is $22.27 (as of 4/26/2024). The most recent quarter's (MRQ) earnings result, annualized, was $3.24/share. Looking at the sum total of quarterly earnings across the trailing twelve month (TTM) period, Forward Air produced $4.08/share. And taking the median quarterly result across the TTM period, and annualizing it, results in $3.8/share. Comparing these various earnings metrics against the stock price, we end up with a PE ratio of 5.9 for the TTM Median method, 6.9 for price to earnings using MRQ annualized, and 5.5 for current price/TTM earnings. Based on FWRD's history, that recent TTM PE is low relative to the historical average, with the recent PE 75.8% lower than the average (TTM method) of 22.7.
FWRD Next Dividend Date » (Projection based upon history) FWRD Dividend Growth Rate » Quotes delayed 20 minutes |
| Avg. Broker Rec.
|
Hold (2.29 out of 4) 6th percentile
(ranked lower than approx. 94% of all stocks covered)
Analysts' Target Price: FWRD Forecast Based on data provided by Zacks Investment Research via Quandl.com |
|
|