SLIDESHOW: Top 10 Best Value Stocks
By Dividend Channel Staff, updated Sun, May 12, 5:19 PM
| This Slide: #2 of 10 |
#9. Markel
Trading Symbol
MKL
Recent Price
1652.22
Dividend Yield
0.00%
TTM Earnings
172.36
PE Ratio (TTM)
9.6
Market Cap
21.5B
#9. Markel
Trading Symbol
MKL
Recent Price
1652.22
Dividend Yield
0.00%
TTM Earnings
172.36
PE Ratio (TTM)
9.6
Market Cap
21.5B
Markel Group is a financial holding company. Through its subsidiaries, Co.'s principal business markets and underwrites specialty insurance products using multiple platforms. Co.'s investing activities are related to its underwriting operations. Co.'s insurance operations include: underwriting, which include its risk-bearing insurance and reinsurance operations; insurance-linked securities (ILS), provide investment management services for various investment products, including ILS, catastrophe bonds, insurance swaps and weather derivatives; and program services, which serves as a fronting platform that provides other insurance entities access to the property and casualty insurance market. More details about Markel at: http://www.markel.com.
 View MKL's Dividend History »
  ETFs holding MKL »
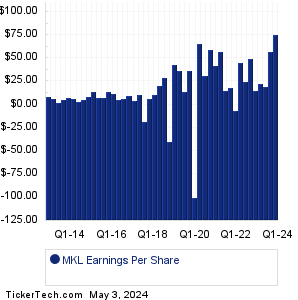
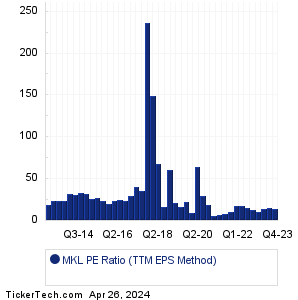
Should Markel shares be counted among the Top 10 Best Value Stocks label? To start, we see that the recent trading price for MKL stock is $1652.22 and the dividend yield is 0.00% (as of 5/10/2024). The most recent quarter's (MRQ) earnings result, annualized, was $301.72/share. Looking at the sum total of quarterly earnings across the trailing twelve month (TTM) period, Markel produced $172.36/share. And taking the median quarterly result across the TTM period, and annualizing it, results in $156.64/share. Comparing the current indicated annual dividend rate of $0.00 against that median result, we calculate a dividend payout ratio of 0.0%. Comparing the company's various earnings metrics against the stock price, we end up with a PE ratio of 10.5 for the TTM Median method, 5.5 for price to earnings using MRQ annualized, and 9.6 for current price/TTM earnings. Based on MKL's history, that recent TTM PE is low relative to the historical average, with the recent PE 69.5% lower than the average (TTM method) of 31.5.
Should Markel shares be counted among the Top 10 Best Value Stocks label? To start, we see that the recent trading price for MKL stock is $1652.22 and the dividend yield is 0.00% (as of 5/10/2024). The most recent quarter's (MRQ) earnings result, annualized, was $301.72/share. Looking at the sum total of quarterly earnings across the trailing twelve month (TTM) period, Markel produced $172.36/share. And taking the median quarterly result across the TTM period, and annualizing it, results in $156.64/share. Comparing the current indicated annual dividend rate of $0.00 against that median result, we calculate a dividend payout ratio of 0.0%. Comparing the company's various earnings metrics against the stock price, we end up with a PE ratio of 10.5 for the TTM Median method, 5.5 for price to earnings using MRQ annualized, and 9.6 for current price/TTM earnings. Based on MKL's history, that recent TTM PE is low relative to the historical average, with the recent PE 69.5% lower than the average (TTM method) of 31.5.
| Avg. Broker Rec.
|
Hold (2.00 out of 4) 0th percentile
(ranked lower than approx. 100% of all stocks covered)
Analysts' Target Price: MKL Forecast Based on data provided by Zacks Investment Research via Quandl.com |
|
|