SLIDESHOW: Top 15 Cheap Stocks
By Dividend Channel Staff, updated Mon, April 29, 9:44 AM
| This Slide: #1 of 15 |
#15. New York Community
Trading Symbol
NYCB
Recent Price
2.97
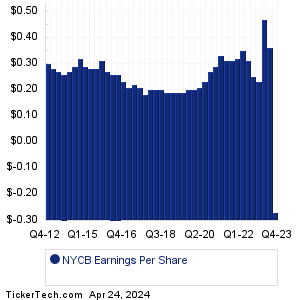
TTM Earnings
0.79
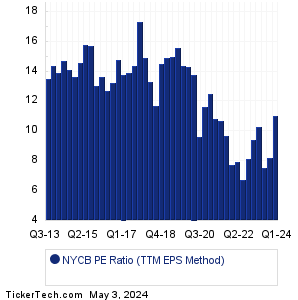
PE Ratio (TTM)
3.8
Avg Past PE (TTM)
12.6
Market Cap
2.4B
#15. New York Community
Trading Symbol
NYCB
Recent Price
2.97
TTM Earnings
0.79
PE Ratio (TTM)
3.8
Avg Past PE (TTM)
12.6
Market Cap
2.4B
New York Community Bancorp is a bank holding company. Through its subsidiary, New York Community Bank (The Bank), Co. operates through eight local divisions: Queens County Savings Bank, Roslyn Savings Bank, Richmond County Savings Bank, Roosevelt Savings Bank, and Atlantic Bank in New York; Garden State Community Bank in New Jersey; Ohio Savings Bank in Ohio: and AmTrust Bank in Florida and Arizona. Co. is also a producer of multi-family loans in New York City, with an emphasis on non-luxury residential apartment buildings with rent-regulated unit. More details about New York Community at: http://www.myNYCB.com.
 ETFs holding NYCB »
Should New York Community shares be counted among the Top 15 Cheap Stocks? To start, we see that the recent trading price for NYCB stock is $2.97 (as of 4/26/2024). The most recent quarter's (MRQ) earnings result, annualized, was $1.44/share. Looking at the sum total of quarterly earnings across the trailing twelve month (TTM) period, New York Community produced $0.79/share. And taking the median quarterly result across the TTM period, and annualizing it, results in $1.16/share. Comparing these various earnings metrics against the stock price, we end up with a PE ratio of 2.6 for the TTM Median method, 2.1 for price to earnings using MRQ annualized, and 3.8 for current price/TTM earnings. Based on NYCB's history, that recent TTM PE is low relative to the historical average, with the recent PE 69.8% lower than the average (TTM method) of 12.6.
Should New York Community shares be counted among the Top 15 Cheap Stocks? To start, we see that the recent trading price for NYCB stock is $2.97 (as of 4/26/2024). The most recent quarter's (MRQ) earnings result, annualized, was $1.44/share. Looking at the sum total of quarterly earnings across the trailing twelve month (TTM) period, New York Community produced $0.79/share. And taking the median quarterly result across the TTM period, and annualizing it, results in $1.16/share. Comparing these various earnings metrics against the stock price, we end up with a PE ratio of 2.6 for the TTM Median method, 2.1 for price to earnings using MRQ annualized, and 3.8 for current price/TTM earnings. Based on NYCB's history, that recent TTM PE is low relative to the historical average, with the recent PE 69.8% lower than the average (TTM method) of 12.6.
NYCB Next Dividend Date » (Projection based upon history) NYCB Dividend Growth Rate » Quotes delayed 20 minutes |
| Avg. Broker Rec.
|
Hold (1.88 out of 4) 0th percentile
(ranked lower than approx. 100% of all stocks covered)
Analysts' Target Price: NYCB Forecast Based on data provided by Zacks Investment Research via Quandl.com |
|
|