SLIDESHOW: Top 10 Best Value Stocks
By Dividend Channel Staff, updated Sun, April 28, 5:44 AM
| This Slide: #1 of 10 |
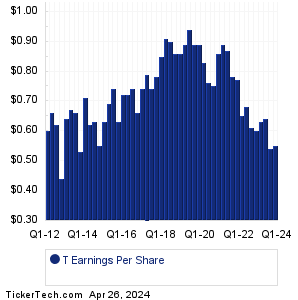
#10. AT&T
Trading Symbol
T
Recent Price
16.75
Dividend Yield
6.63%
TTM Earnings
2.36
PE Ratio (TTM)
7.1
Market Cap
119.8B

#10. AT&T
Trading Symbol
T
Recent Price
16.75
Dividend Yield
6.63%
TTM Earnings
2.36
PE Ratio (TTM)
7.1
Market Cap
119.8B
AT&T is a holding company. Through its subsidiaries, Co. is a provider of telecommunications, media and technology services globally. Co. has three reportable segments: Communications, which provides wireless and wireline telecom, video and broadband services to consumers; WarnerMedia, which is comprised of media and entertainment company that develops, produces and acquires feature films, television, gaming and other content for monetization in various media outlets including theatrical, its own and third-party basic and premium pay television, free-to-air television, direct-to-consumer services and physical / digital retail; and Latin America, which provides wireless services in Mexico. More details about AT&T at: http://www.att.com.
 View T's Dividend History »
  ETFs holding T »
Should AT&T shares be counted among the Top 10 Best Value Stocks label? To start, we see that the recent trading price for T stock is $16.75 and the dividend yield is 6.63% (as of 4/26/2024). The most recent quarter's (MRQ) earnings result, annualized, was $2.2/share. Looking at the sum total of quarterly earnings across the trailing twelve month (TTM) period, AT&T produced $2.36/share. And taking the median quarterly result across the TTM period, and annualizing it, results in $2.36/share. Comparing the current indicated annual dividend rate of $1.11 against that median result, we calculate a dividend payout ratio of 47.0%. Comparing the company's various earnings metrics against the stock price, we end up with a PE ratio of 7.1 for the TTM Median method, 7.6 for price to earnings using MRQ annualized, and 7.1 for current price/TTM earnings. Based on T's history, that recent TTM PE is low relative to the historical average, with the recent PE 16.5% lower than the average (TTM method) of 8.5.
Should AT&T shares be counted among the Top 10 Best Value Stocks label? To start, we see that the recent trading price for T stock is $16.75 and the dividend yield is 6.63% (as of 4/26/2024). The most recent quarter's (MRQ) earnings result, annualized, was $2.2/share. Looking at the sum total of quarterly earnings across the trailing twelve month (TTM) period, AT&T produced $2.36/share. And taking the median quarterly result across the TTM period, and annualizing it, results in $2.36/share. Comparing the current indicated annual dividend rate of $1.11 against that median result, we calculate a dividend payout ratio of 47.0%. Comparing the company's various earnings metrics against the stock price, we end up with a PE ratio of 7.1 for the TTM Median method, 7.6 for price to earnings using MRQ annualized, and 7.1 for current price/TTM earnings. Based on T's history, that recent TTM PE is low relative to the historical average, with the recent PE 16.5% lower than the average (TTM method) of 8.5.
T Next Dividend Date » (Projection based upon history) T Dividend Growth Rate » Quotes delayed 20 minutes |
| Avg. Broker Rec.
|
Buy (3.11 out of 4) 40th percentile
(ranked lower than approx. 60% of all stocks covered)
Analysts' Target Price: T Forecast Based on data provided by Zacks Investment Research via Quandl.com |
|
|